
Everything about Top command in ubuntu 22.04
Top is one of the tools for monitoring system usage and also to make any change for improving system performance.
Introduction:
The top program offers a dynamic real-time view of a running system. It can show system summary information as well as a list of tasks currently being managed by the Linux kernel. The types of system summary info shown and the types, order and size of information presented for tasks are all end user configurable and that configuration can be made persistent across restarts
Without any arguments :
# top

Read Also: [Security Device] List of Top Fortinet FortiWeb Web Application Firewalls 2021
Generally, we use top without any arguments, but the magic is mostly done from the top command line which must of us skip. Well before taking will to that part let me explain will the various system related features which are shown by top command.
NOTE: Will can enable or disable the marked line by pressing “l” once top is running
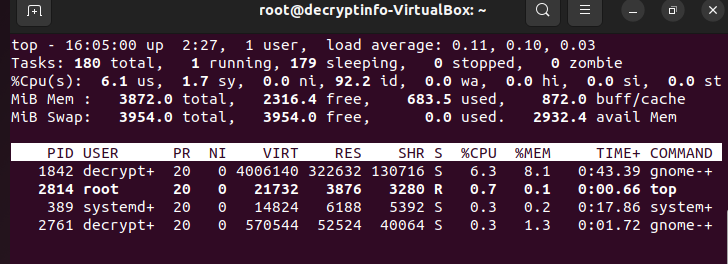
Explanation: This line tells will about the uptime of system along with load average value.
NOTE: Will can enable/disable the marked line by pressing “t“.

Read Also: How to Launch Paros Proxy GUI in Kali Linux 2021?
Explanation: This line gives us a brief detail of all the tasks running/sleeping/stopped currently in the system along with the CPU Usage
| Value | Meaning |
| us | user cpu time (or) % CPU time spent in user space |
| sy | system cpu time (or) % CPU time spent in kernel space |
| ni | user nice cpu time (or) % CPU time spent on low priority processes |
| id | idle cpu time (or) % CPU time spent idle |
| wa | io wait cpu time (or) % CPU time spent in wait (on disk) |
| hi | hardware irq (or) % CPU time spent servicing/handling hardware interrupts |
| si | software irq (or) % CPU time spent servicing/handling software interrupts |
| st | steal time – – % CPU time in involuntary wait by virtual cpu while hypervisor is servicing another processor (or) % CPU time stolen from a virtual machine |
NOTE: Will can enable/disable the marked line by pressing “m“.
Read Also : Difference between Encryption and Decryption

Explanation: The next line shows memory (RAM and swap) usage and capacity.
The left sections show will the details of the process running along with the below details.
| Fields/Column | Description |
| PID | Process Id |
| USER | The effective user’s name of the task’s owner |
| PR | The priority of the task |
| NI | The nice value of the task. A negative nice value means higher priority, whereas a positive nice value means lower priority. Zero in this field simply means priority will not be adjusted in determining a task’s dispatchability |
| %CPU | The task’s share of the elapsed CPU time since the last screen update, expressed as a percentage of total CPU time. |
| %MEM | A task’s currently used share of available physical memory |
| TIME+ | Total CPU time the task has used since it started |
| S | The status of the task which can be one of:
‘D’ = uninterruptible sleep ‘R’ = running ‘S’ = sleeping ‘T’ = traced or stopped ‘Z’ = zombie |
| RES | The non-swapped physical memory a task has used |
| SHR | The amount of shared memory used by a task |
| Command | Display the command line used to start a task or the name of the associated program |
Arrange Tasks with High to Low CPU Usage:
Press “P” or “shift+p” once top is running to arrange all the tasks with High to Low CPU Usage as shown below.
Read Also :BEST 2022: MCQ OF PROJECT MANAGEMENT
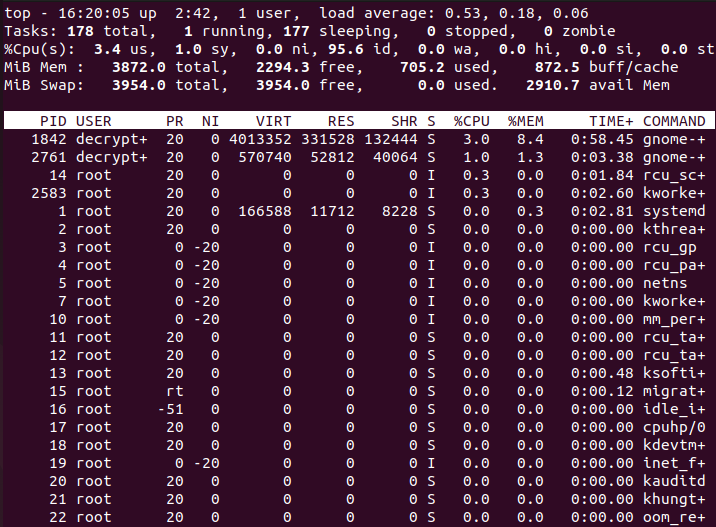
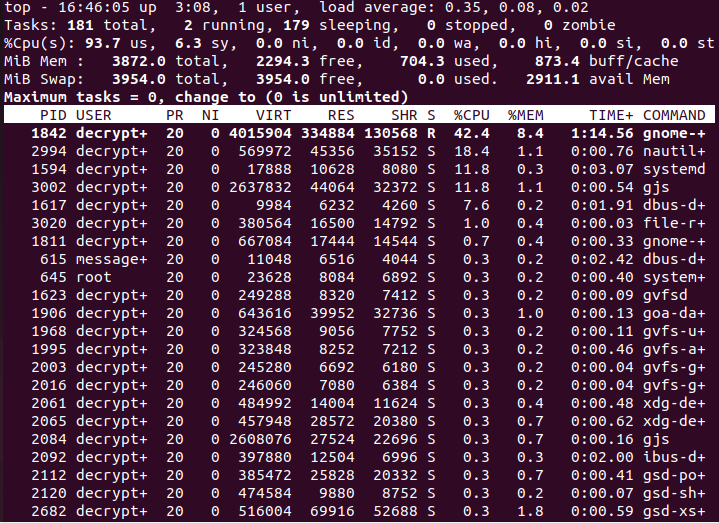
Arrange Tasks with High to Low Memory Usage.
Press “M” or “shift+m” once top is running to arrange all the tasks with High to Low Memory Usage as shown below.

Change the nice value (priority) of any task
To understand what is nice value follow the below link
What is nice and how to change the priority of any process in Linux?
Press “r” when top is running on the terminal. Will should get a prompt as shown below in color.

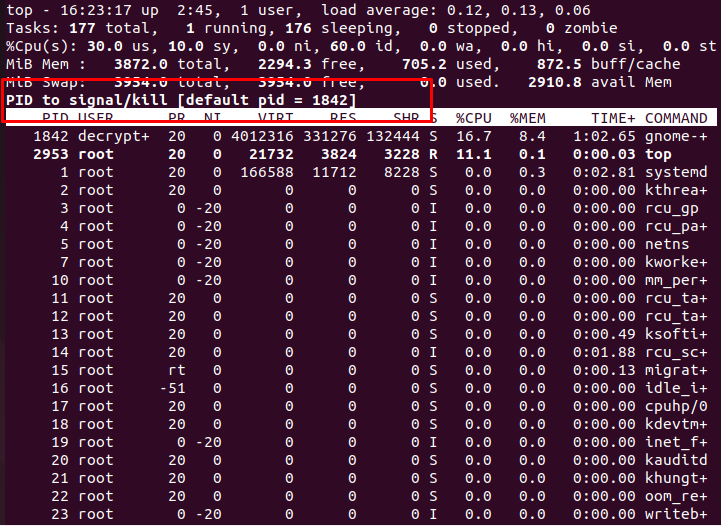
Kill any task
Press “k” on the terminal when top is running. Will should get a prompt as shown below in color
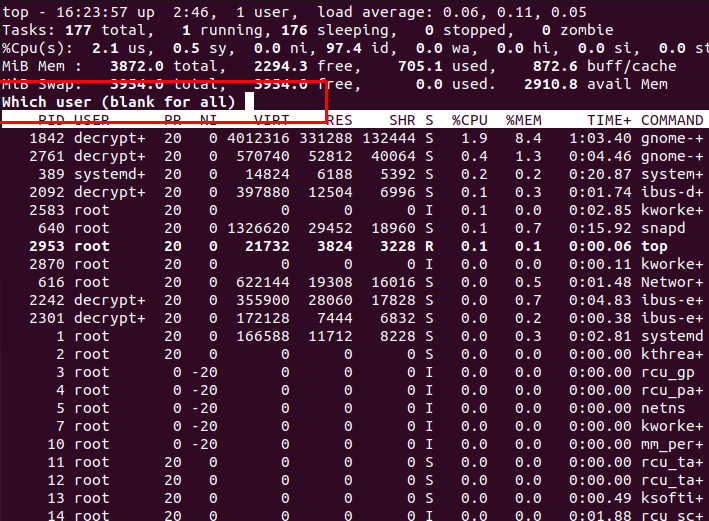
View all the processes running by a user
Press “u” on the terminal when top is running. Will should get a prompt as shown below in color
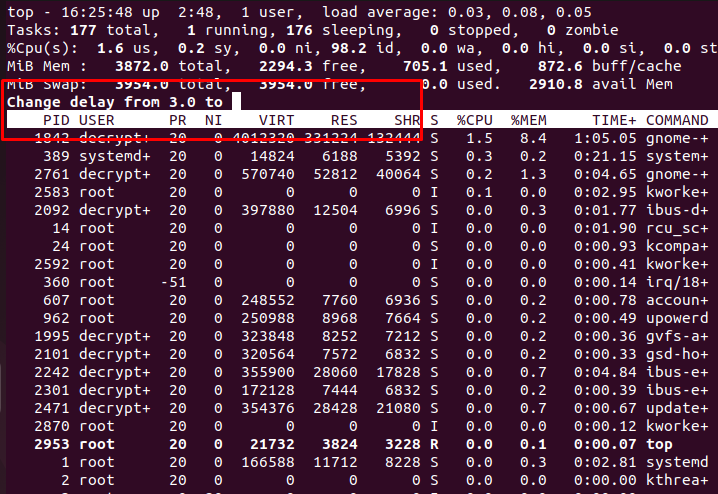
Change delay between terminal refresh
By default, the top terminal is set for auto refresh after every 3 seconds but if will want will can change it as per requirement.
Press “d” when top is running. Will should get a prompt as shown below in color.
No. of task to be displayed
By default, this option is set to unlimited that is the reason terminal is fully covered with list of tasks when will run the top command. Any how will can list the no of tasks to be visible once will run top command.
Press “n“when top is running. Will should get a prompt as shown below in color
Read Also :2022: Best 13+ Proxy Network Software
View live individual CPU processor performance :
By default top command shows will the average of all the available CPUs in the machine.
Add a new field in top output :
By default, will see limited set of output when will use the top command. But apart from those there are a other list of field which can be added to the top output. To view all the list f field which can be added follow the below steps.Run top command and then,
Press “f” which will take will the list of available fields under top command.
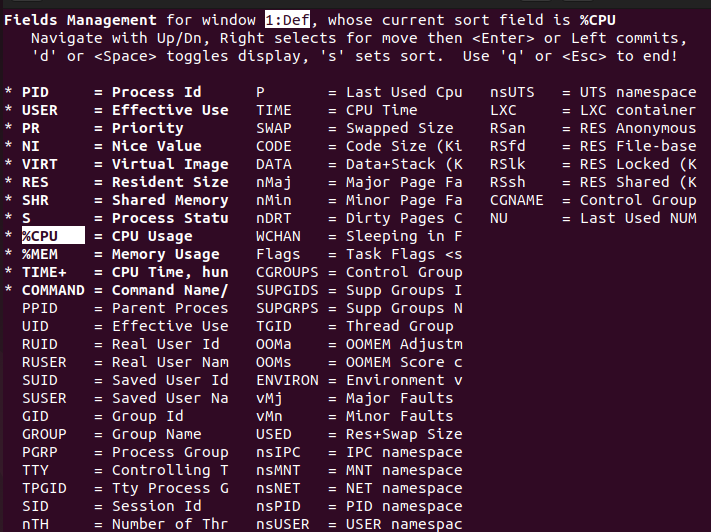
All the field initials stated in BLOCK letters are visible by default when will issue top command. To add a new field, press the field initial as shown in the first column.